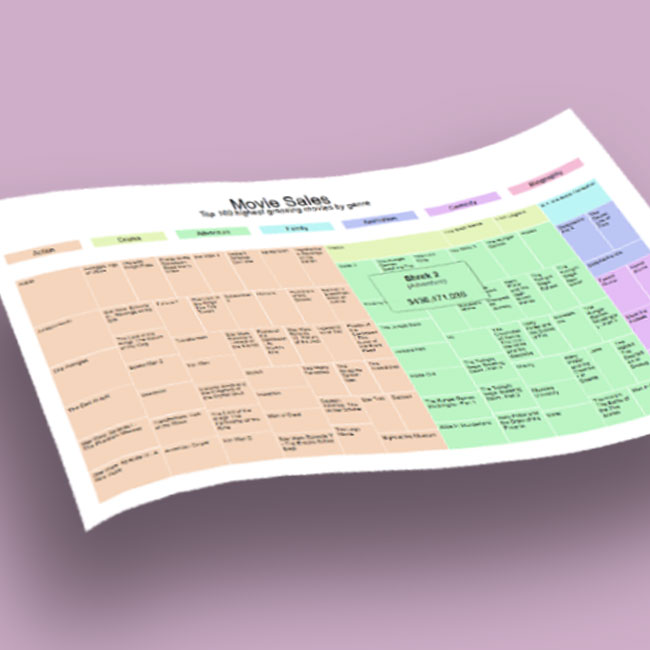
Treemap Visualization
A visualization of the highest-grossing movies using D3.js to generate an SVG graphic.
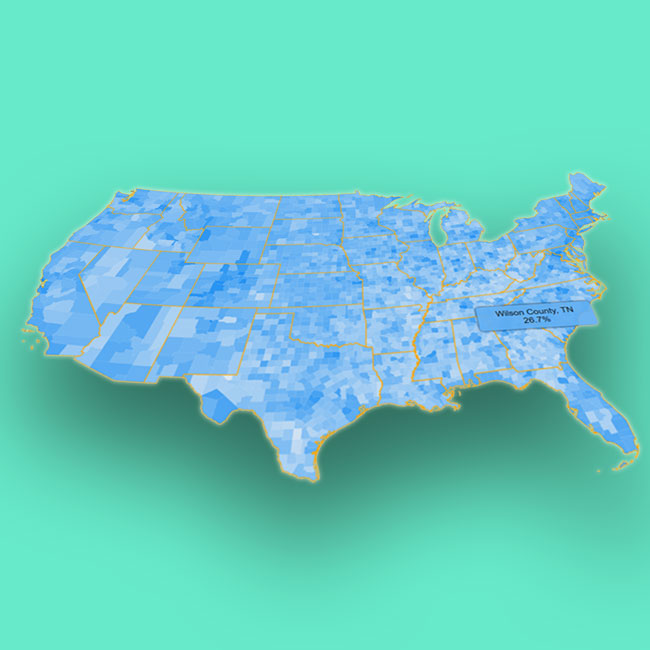
Choropleth Map Visualization
An interactive map of higher education rates per USA county.
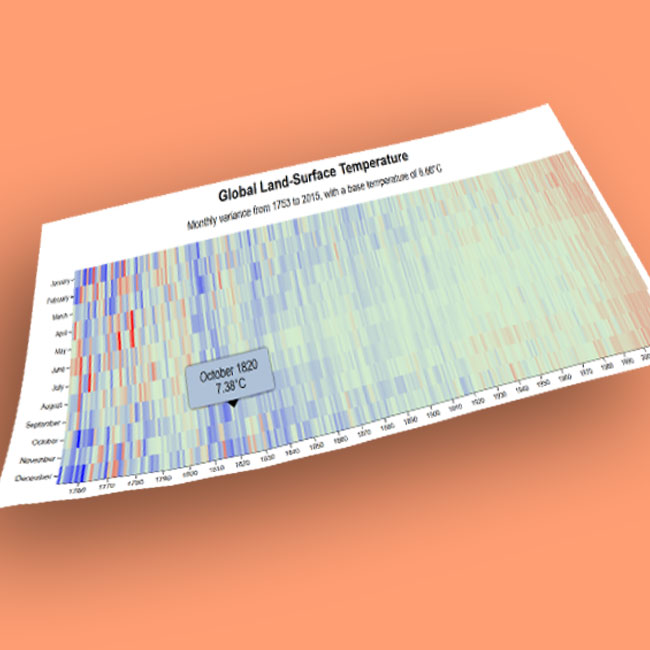
Heat Map Visualization
An interactive visualization of global land-surface temperatures since 1753.
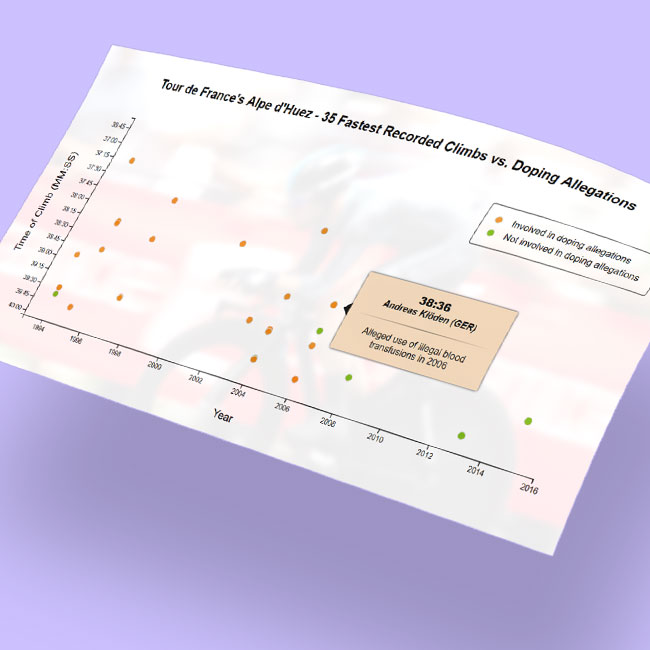
Scatterplot Visualization
A graph showing doping allegations against the fastest climber’s at the Alpe d’Huez in the Tour de France.
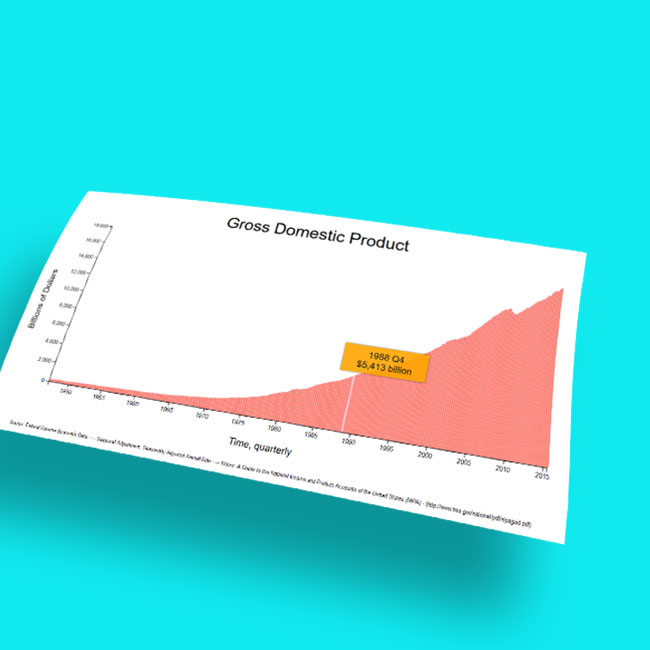
Bar Chart Visualization
A visualization of the United State’s GDP since 1947.

Product Landing Page
A simple one-page website for a fake company.
©2019 JulianNF | Template by Bootstrapious.com, ported to Hugo by Kishan B, and modified by JulianNF